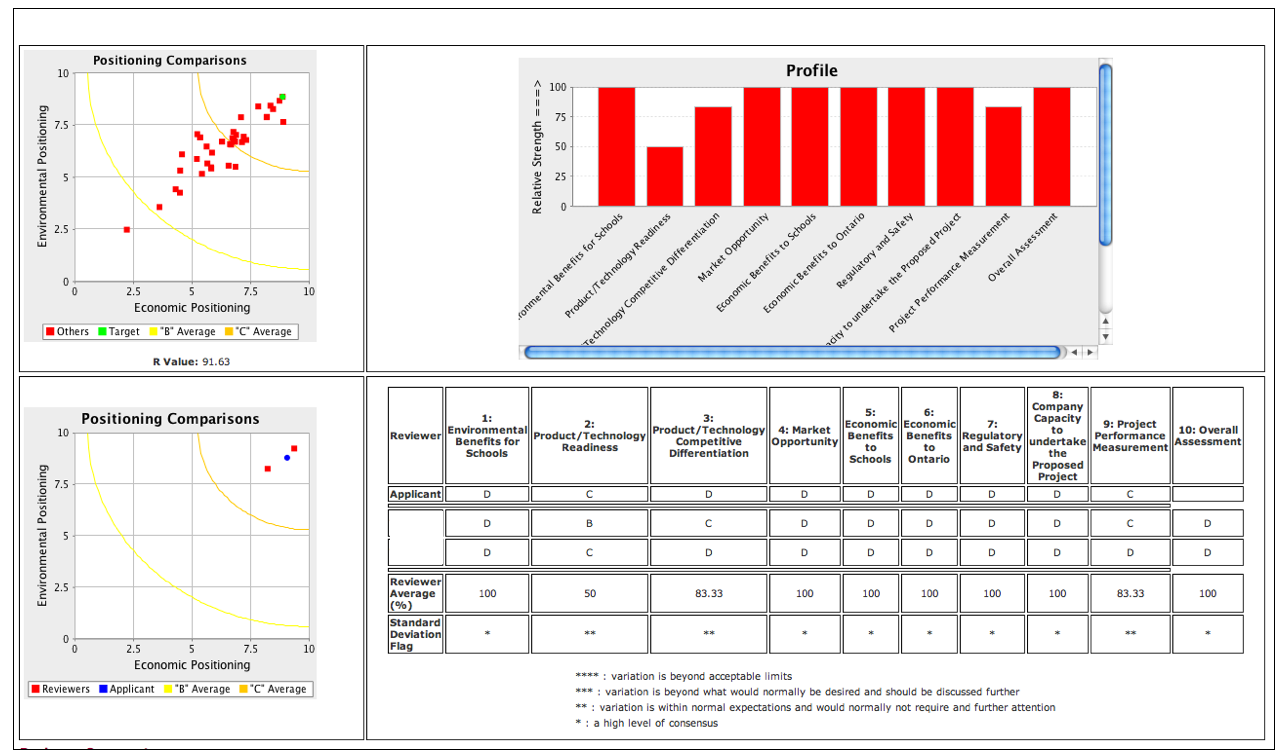
The results of the review process are typically summarized on an “R chart” that show the applications based on how they were evaluated by reviewers (Proposal data suppressed in the screenshot below). Access to drill-down information from applications or reviews can be displayed in real-time as required with one or two mouse-clicks.
The results for each individual application are presented in displays similar to the following. This enables a Selection Committee to discuss in real time the positioning of each application, the degree of variable in reviewer assessments, particular strengths and weaknesses, etc. It is not unusual for a Selection Committee to process well over 100 applications in a one-day Selection Committee meeting. (Proposal and reviewer names suppressed)

